Collection of my ‘Data Science’ and ‘Research’ related articles on Medium
This post is a collection of my articles published on Medium which are majorly related to Time Series Analysis, Data Science, and Research.
My research work is majorly moving around Data Science, Time Series Analysis and their applications in different domains. While doing so, I came across several difficulties, problems, and possible solutions. I have been collaborating with many professionals, which involves Professors, Researchers, Data Scientists, and Managers among others. Each professional had his distinct skills and I have tried to grab some of them. Based on my experience, I have tried to document my thoughts and research directions in the form of Medium stories. This is my Medium writer profile: https://neerajdhanraj.medium.com/. You may follow me on Medium for regular updates.
In this post, I have tried to collect my Medium articles that are majorly related to Time Series Analysis, Data Science, and Research.
- How do I use R while my collaborators use Python?
- The R language is a lucrative tool for researchers, data scientists especially in new methodologies and visualization techniques. I have seen many researchers used to move between R and Python several times, due to several reasons. One of the major reasons is that if their collaborators have been using Python in their team. One may feel that the code integration in the same language can be an easy task and it can be challenging to integrate the scripts from two different languages (i.e. R and Python).
- Perform a Forecast analysis when you don’t know how to coding
- Time series analysis is one of the vital parts of the Data Science techniques. It plays an important role in many applications in several domains such as energies, banking, finance, healthcare, education, environment, resource management, etc. There are several tools for time series forecasting, prediction, and performance evaluations. Time series analysis majorly characterized as supervised methods, where the time series is segmented into two parts, i.e., training and testing. The training part should be the longer part, say 70 to 90% initial values in the time series on which time series methods are modeled (Find some example here). The leftover last part of the time series is used for evaluation purposes, on which forecasted values are compared and based on it the accuracy of a method is evaluated.
- The R and Python are the leading languages for such analysis. The testbench like ForecastTB makes such analysis more user-friendly and reproductive. So far, it is a challenging task for users who are not used to the coding skills to perform such analysis. This post is introducing a website (shiny app) to use the features of the ForecastTB package for the users who are not familiar with the coding. Let’s go the procedure step by step.
- Make computational (Ph.D.) research reproducible wide-spread with R packages
- Being a data science researcher, I was having two options to reproduce the method, i.e., R and Python. Both of these are open source tools and popular in data analysis. I prefer to go with R and it benefited me in many ways. I have discussed its benefits in this post.
- How to publish R packages in good journals?
- Publishing R packages in reputed journals is a great option to bring your R package in the traditional research and make researchers try-on. It is true that the R package itself is the citable entity, but making available it in publication format has several benefits that are discussed in this post.
- How R and R-Studio can make the writing manuscripts easy for several journals?
- The R language provides many benefits such as reproducible research, greater visualization, and a huge audience for your research. Also, we have discussed how and where the research contributed in the R can be published in reputed journals. Now, consider, you are ready with some research contribution in the R and now in a position to draft a manuscript for the methodology or the R package. If it is a methodology implemented in R and you wish to discuss its performance in your manuscript. In such a case, you may start with an introduction, literature review, proposed methodology sections followed by the results, performance evaluation, and plots you achieved in the R. Finally, you may conclude the manuscript with some remarks. If it is so, you will start by writing all the texts in the respective sections, citations, tables, equations, and figures. These figures and tables can be the output of the analysis done in R. If you are willing to draft the manuscript in LaTeX in the traditional way, you will chalk out all analysis and make a table in the Latex, and you may upload the same figure produced in the R study. Consider it is a manuscript introducing an R package, the manuscript will be full of R code chunks, R function descriptions, and respective case studies with output plots. It can be really challenging for authors to draft such kind of manuscript with code chunks and other R material in traditional latex format of the journals. You might have observed in several articles, some of them have written the codes very much similar to the original format and fonts, but many of them failed to do so. To avoid the code chunks in the manuscript, some authors preferred to provide the code as a supplement material. To avoid such a situation, this post is demonstrating how R and R-Studio can be used to write a manuscript for several journals with minimum efforts and how the R codes chunks and corresponding output can be directly embedded in the manuscript.
- Easy steps to develop and publish your first R package
- Many researchers avoid developing the R package due to a lack of knowledge of possibilities and the tedious procedure to develop the R packages. This post is to demonstrate the easiest steps to develop an R package with minimum efforts. Also, it discusses the possible warnings and corresponding solutions.
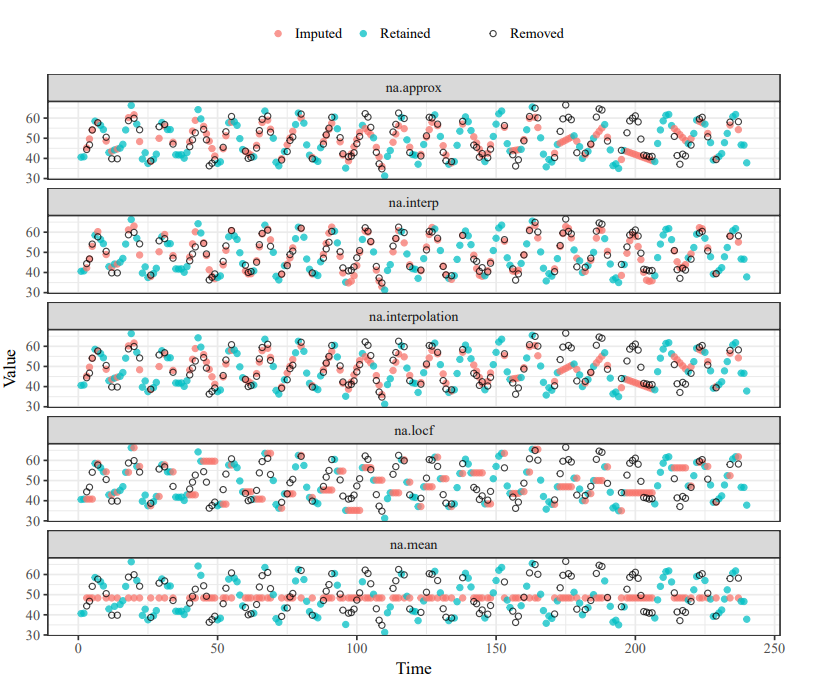
- Automation package to impute missing values in a time series
- Missing observations are common in time series data and several methods are available to impute these values prior to analysis. Variation in statistical characteristics of univariate time series can have a profound effect on the characteristics of missing observations and, therefore, the accuracy of different imputation methods. This post present example of applications that demonstrate how the
imputeTestbenchpackage can be used to understand differences in prediction accuracy between methods as affected by characteristics of a dataset and nature of missing data.
- Missing observations are common in time series data and several methods are available to impute these values prior to analysis. Variation in statistical characteristics of univariate time series can have a profound effect on the characteristics of missing observations and, therefore, the accuracy of different imputation methods. This post present example of applications that demonstrate how the
- A tool to ease and reproduce the univariate time series forecast/prediction analysis
- It is very important to make computational research reproducible and easy to analyze. There are several benefits in doing so and some of them are discussed here. In the field of Data Science, prediction and forecasting methods are very crucial processes. The ultimate objectives of data science projects are majorly affected by the performance of forecasting/prediction methods, therefore an accurate selection of these methods is a crucial task. Besides, nowadays, a large number of such methods are available and it is becoming a tedious task to choose a more appropriate model among the pool of them. Surely, if there is a tool that can automate this procedure with minimum efforts, it can be handy stuff for Data Science Researchers, Data Scientists, Data Analysts, and Academicians. This post is an introduction and demonstration to such a handy tool, an R package, named
ForecastTB.
- It is very important to make computational research reproducible and easy to analyze. There are several benefits in doing so and some of them are discussed here. In the field of Data Science, prediction and forecasting methods are very crucial processes. The ultimate objectives of data science projects are majorly affected by the performance of forecasting/prediction methods, therefore an accurate selection of these methods is a crucial task. Besides, nowadays, a large number of such methods are available and it is becoming a tedious task to choose a more appropriate model among the pool of them. Surely, if there is a tool that can automate this procedure with minimum efforts, it can be handy stuff for Data Science Researchers, Data Scientists, Data Analysts, and Academicians. This post is an introduction and demonstration to such a handy tool, an R package, named
- A tool to estimate time and memory complexities of algorithms with minimum efforts
- When an algorithm or a program runs on a computer, it requires some resources. The complexity of an algorithm is the measure of the resources, for some input. These resources are usually space and time. Thus, complexity is of two types: Space and Time Complexity. The time complexity defines the amount it takes for an algorithm to complete its execution. This may vary depending on the input given to the algorithm. For example, if the algorithm under consideration is Bubble Sort and the input is a sorted array, then the time complexity will be less. This is called the best-case complexity. When the input array is reversed, the algorithm takes much more time to sort the array. This is the worst-case complexity. When the input array is neither sorted nor reversed, the time complexity lies between the best-case and worst-case complexities. This is called average-case complexity. The exact time required for an algorithm to complete execution varies greatly from computer to computer. Thus, we actually focus on the behavior of the complexity when the input size increases. This is the asymptotic behavior of the complexity. There are various notations used to represent the asymptotic complexity of such as big O, big omega, big theta, etc. The complexity of the Bubble sort algorithm is O(n2) in the worst case. Since the running time cannot be greater than the worst-case scenario, the worst-case complexity is usually considered. The algorithm that has lower complexity is said to be more efficient than the algorithm having more complexity. So, when developing new algorithms, developers need to check its complexity. This process is quite time-consuming. Knowing the approximate execution time of a new piece of code, before running it in full scale, could save a lot of time. Calculating the complexity using various manual methods(such as master theorem) is a tedious process and more prone to errors. These methods are being challenged by the Empirical methods, which try to give an estimate of the complexity by observing the code being run several times.
- PSF: a good alternative to the ARIMA method for seasonal univariate time series forecasting
- In this post, I have introduced and demonstrated a very interesting R package for time series forecasting, which can be an excellent alternative and replacement for the benchmarked forecasting methods, especially for the time series with seasonal characteristics.
- Effective Flatforms to Showcase the Research on the Internet
- For individual researchers, it is very crucial to showcase his/her research findings and contributions. This post is a systematic review of online platforms to showcase the research profiles on the internet.